This is Part 2 of the transmit power series. In Part 1, I covered the theory behind AP transmit power, client transmit power, EIRP, and the loud AP problem.
In this part, I wanted to test the theory in a small lab.
The goal was simple:
If I increase AP transmit power, does the link improve in both directions, or does only the client hear the AP better?
This is the core of the loud AP problem. Making the AP louder may improve the downlink from AP to client, but it does not automatically improve the uplink from client to AP.
Lab SSID and Network
The test SSID was:
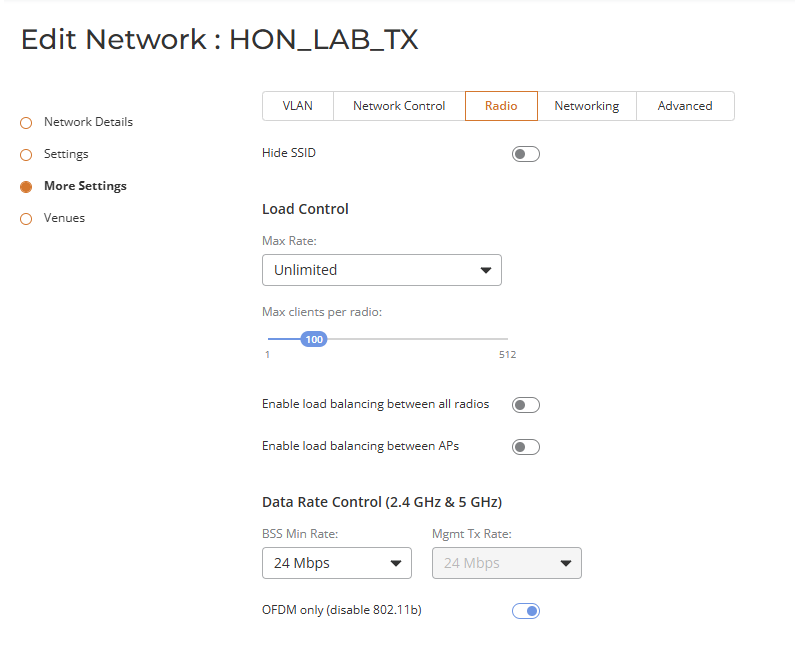
HON_LAB_TX
For this first round of testing, the SSID was enabled on 5 GHz only.
I intentionally did not enable the same SSID on both 2.4 GHz and 5 GHz. If both bands were enabled, band selection or band steering could become an extra variable. Since the purpose of this test was transmit power behavior, I wanted to keep the RF conditions as predictable as possible.
The lab SSID was placed in a dedicated lab network/zone instead of my normal home network. Clients on this SSID were allowed to reach the internet and required gateway services, but were isolated from the rest of the internal network.
Single-AP Test Setup
The first test used a single Ruckus AP.
Only one lab AP was active for the SSID during the baseline test. The other lab APs were kept out of the test so that roaming, AP selection, and cell overlap would not influence the results.
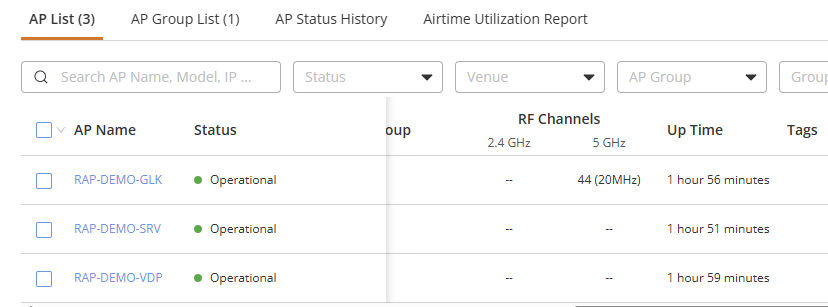
The baseline test used the following settings:
| Setting | Value |
|---|---|
| SSID | HON_LAB_TX |
| Vendor | Ruckus Wireless |
| Band | 5 GHz |
| Main channel | 44 |
| Main channel width | 20 MHz |
| DFS comparison channel | 100 |
| Security | WPA3 Personal |
| Country code | BE |
The AP transmit power was changed manually between test runs.
Single-AP Test Plan
The main comparison used the same AP, same SSID, same client location, same band, same channel width, and the same channel.
Only the AP transmit power was changed.
| Test | Channel | Width | AP Tx Power | Purpose |
|---|---|---|---|---|
| 1 | 44 | 20 MHz | Low | Baseline |
| 2 | 44 | 20 MHz | Medium | Compare against low power |
| 3 | 44 | 20 MHz | High | Highest value used on channel 44 |
| 4 | 100 DFS | 20 MHz | Max available | DFS channel comparison |
The low, medium, and high tests on channel 44 are the cleanest comparison because only the AP transmit power changed.
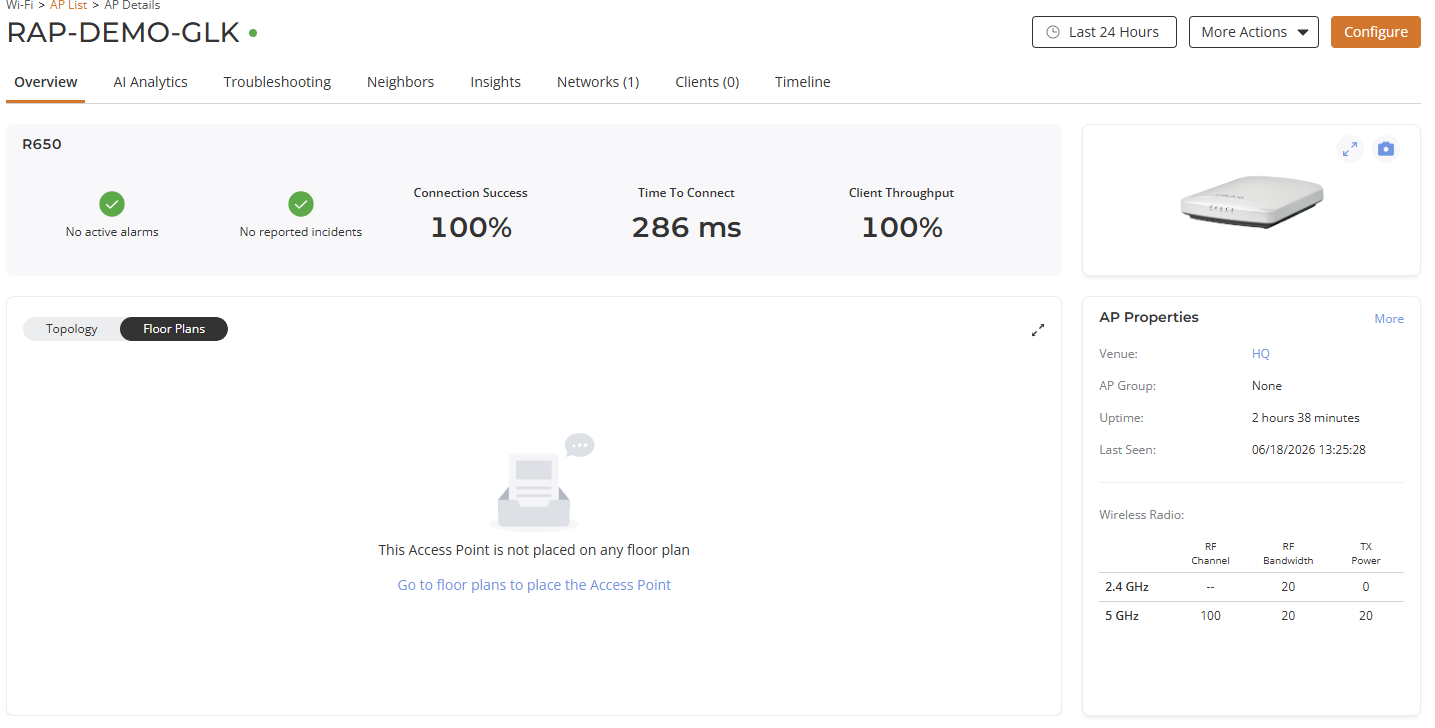
The DFS channel 100 test is different. I originally expected channel 100 to allow a higher configured transmit power, but in this lab the Ruckus AP did not allow me to configure more than 20 dBm on channel 100.
That result is useful by itself. It is a reminder that the power level exposed by a controller is not only determined by a regulatory table. It also depends on the AP model, regulatory domain, firmware/controller behavior, antenna design, and how the vendor exposes transmit power.
Because channel 100 changes the frequency range and introduces DFS behavior, I treat it as a separate comparison rather than a perfect power-only test.
What I Captured
For each test run, I captured three views.
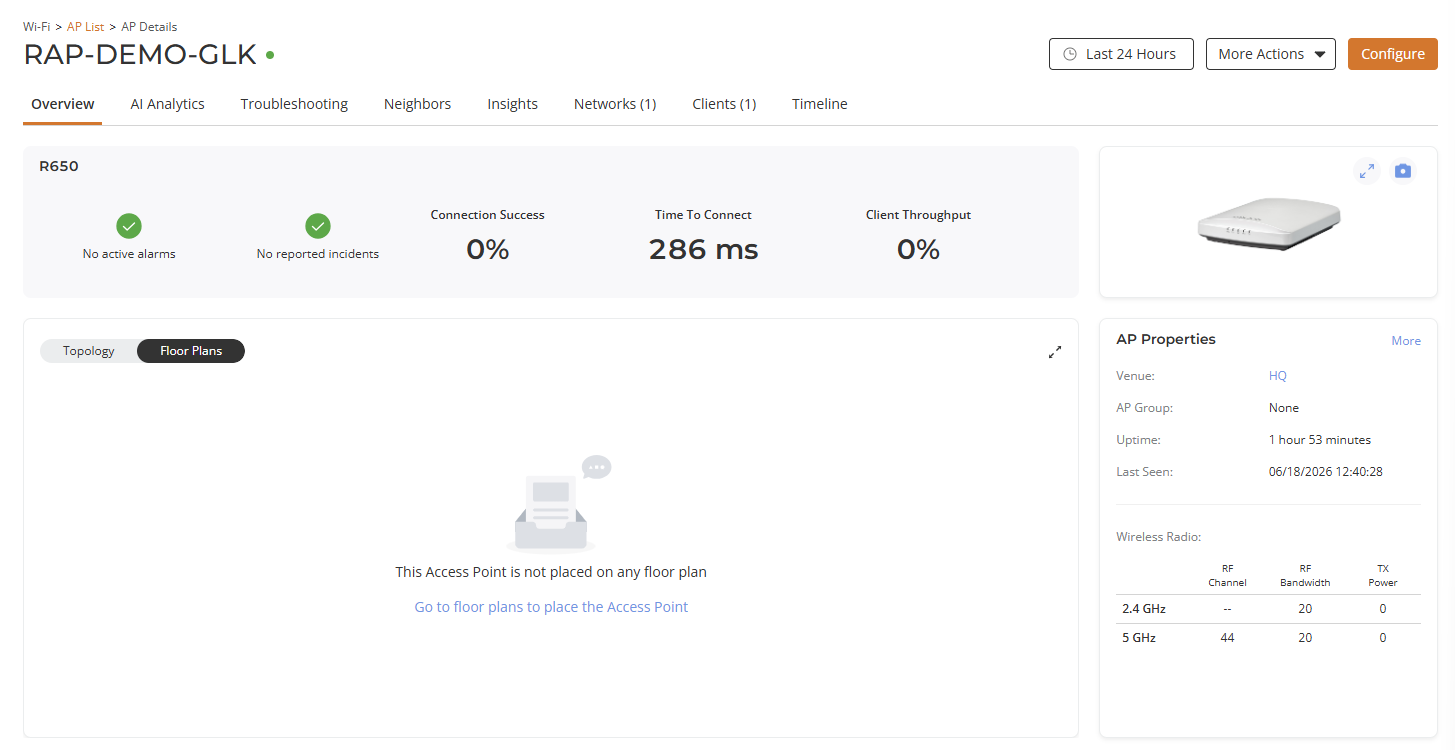
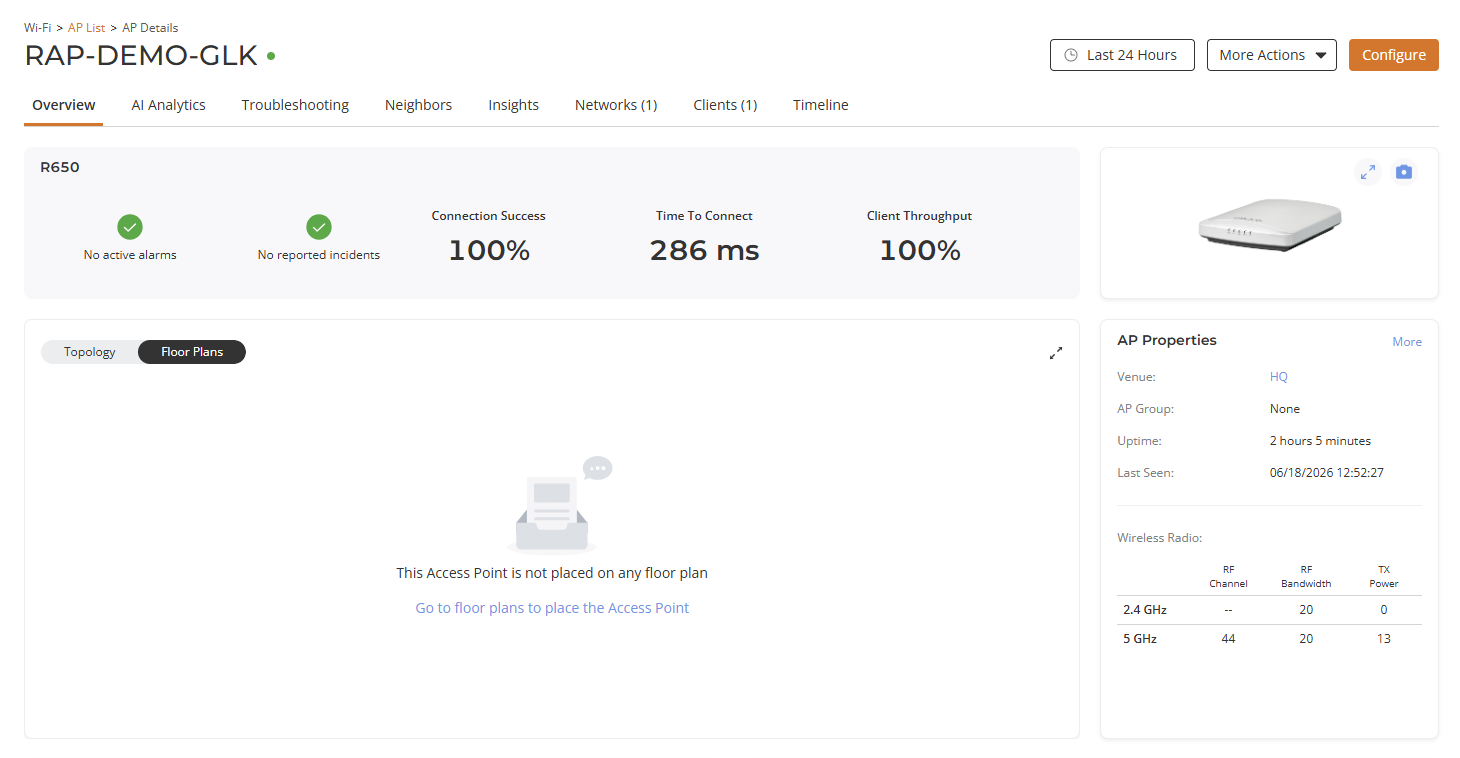
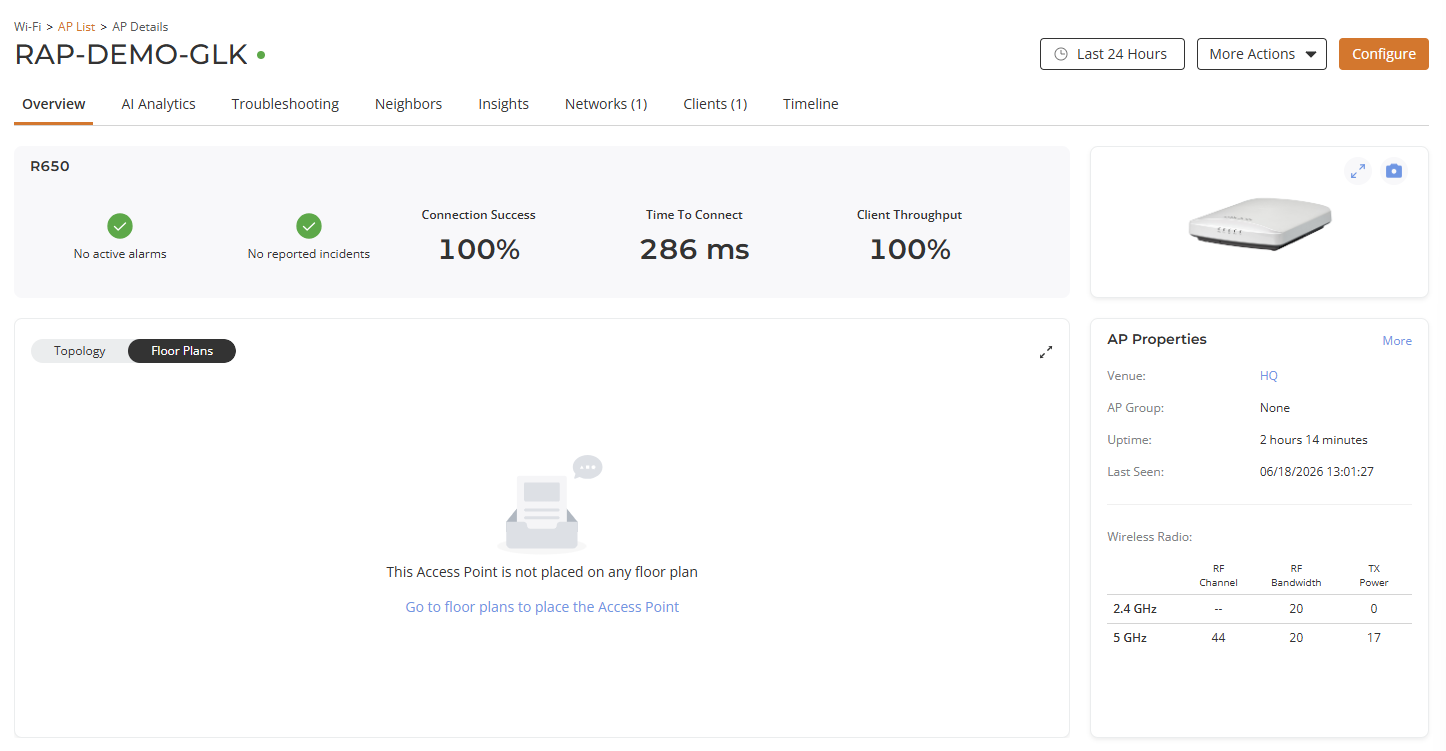
The first view was the AP radio configuration. This proves the configured channel, channel width, and transmit power used for that test.
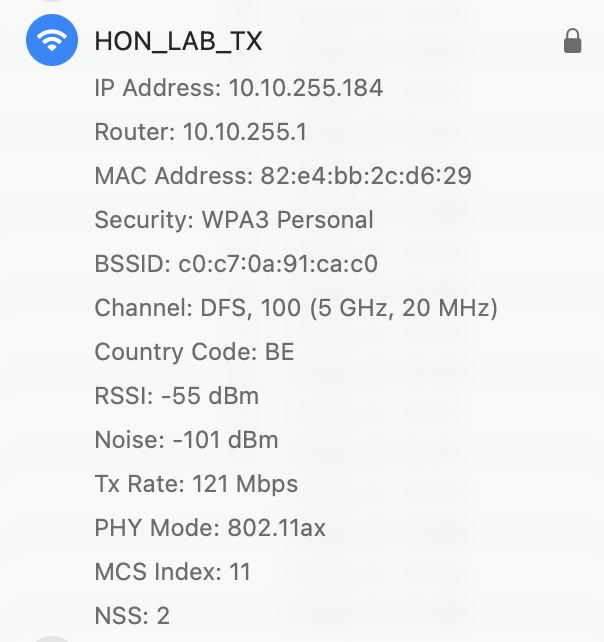
The second view was the client-side Wi-Fi information. This shows how the client hears the AP. On macOS, this included values such as RSSI, noise, Tx rate, PHY mode, MCS index, and spatial streams.
The third view was the controller-side client information. This shows how the AP/controller sees the client. This is the important uplink perspective.
That distinction matters:
The client-side screenshot shows how the client hears the AP. The controller-side screenshot shows how the AP hears the client.
That is the core of the loud AP problem.
Client Devices
I used two client devices during the test:
| Client | Role |
|---|---|
| MacBook | Primary measurement client |
| iPhone | Secondary comparison client |
The MacBook is useful as a primary test client because macOS exposes detailed Wi-Fi information such as RSSI, noise, Tx rate, PHY mode, MCS, and NSS.
The iPhone is useful as a second client because it represents a different client radio, antenna design, and operating system behavior. It is not meant to replace the MacBook measurements, but it provides an extra comparison point.
This also fits the LCMI idea: different clients can behave differently in the same RF environment. A design that looks fine from one client may not look the same from another.
AP Radio Configuration Evidence
For the channel 44 tests, the AP remained on the same 5 GHz channel with the same 20 MHz channel width. Only the transmit power setting was changed.
For the DFS comparison, the AP was moved to channel 100.
Client-Side Results
From the MacBook client side, the result is clear: increasing AP transmit power improved the RSSI reported by the client.
| Test | Channel | Width | AP Tx Power | Client RSSI | Noise | SNR | Tx Rate | PHY | MCS | NSS |
|---|---|---|---|---|---|---|---|---|---|---|
| 1 | 44 | 20 MHz | Low | -70 dBm | -99 dBm | 29 dB | 258 Mbps | 802.11ax | 10 | 2 |
| 2 | 44 | 20 MHz | Medium | -56 dBm | -100 dBm | 44 dB | 286 Mbps | 802.11ax | 11 | 2 |
| 3 | 44 | 20 MHz | High | -52 dBm | -100 dBm | 48 dB | 270 Mbps | 802.11ax | 8 | 2 |
| 4 | 100 DFS | 20 MHz | Max available | -55 dBm | -101 dBm | 46 dB | 121 Mbps | 802.11ax | 11 | 2 |
The low-to-medium change is especially visible:
Low power:    -70 dBm
Medium power: -56 dBm
Difference:   +14 dB
The low-to-high change is even larger:
Low power:  -70 dBm
High power: -52 dBm
Difference: +18 dB
From the client perspective, the AP became much easier to hear.
That part is expected.
The AP became louder, so the client heard it better.
Controller-Side Results
The more important part of the test is the controller-side view.
The controller/AP-side value shows how the AP hears the client. This is the uplink side of the connection.
| Test | Channel | AP Tx Power | Client-Side RSSI | Controller/AP-Side Client RSSI | Link Balance | Observation |
|---|---|---|---|---|---|---|
| 1 | 44 | Low | -70 dBm | -63 dBm | AP hears client 7 dB stronger | Baseline |
| 2 | 44 | Medium | -56 dBm | -64 dBm | Client hears AP 8 dB stronger | AP is louder; client is not |
| 3 | 44 | High | -52 dBm | -62 dBm | Client hears AP 10 dB stronger | Downlink improved; uplink stayed similar |
| 4 | 100 DFS | Max available | -55 dBm | -64 dBm | Client hears AP 9 dB stronger | DFS comparison, not pure power-only |
This is the table that matters most for the loud AP discussion.
The client-side RSSI improved significantly:
Low power:  -70 dBm
High power: -52 dBm
Change:     +18 dB
The controller/AP-side client RSSI did not improve in the same way:
Low power:  -63 dBm
Medium:     -64 dBm
High power: -62 dBm
Range:       2 dB
That is the key result.
Increasing AP transmit power made the AP easier for the client to hear, but it did not make the client easier for the AP to hear.
In other words:
Making the AP louder does not make the client louder.
That is the loud AP problem in practice.
DFS Channel 100 Comparison
I also tested DFS channel 100.
This was not a pure transmit power comparison because the channel changed from channel 44 to channel 100. The frequency range, regulatory behavior, and DFS requirements are different.
| Test | Channel | Width | AP Tx Power | Client RSSI | AP-Side Client RSSI | Noise | SNR | Tx Rate | PHY | MCS | NSS |
|---|---|---|---|---|---|---|---|---|---|---|---|
| 4 | 100 DFS | 20 MHz | Max available | -55 dBm | -64 dBm | -101 dBm | 46 dB | 121 Mbps | 802.11ax | 11 | 2 |
I originally expected channel 100 to allow a higher configured transmit power. In this lab, the Ruckus AP did not allow me to configure more than 20 dBm on channel 100.
That is a useful result by itself.
It shows that the transmit power available in the controller depends on the AP model, regulatory domain, firmware/controller behavior, channel, antenna design, and how the vendor exposes transmit power. It is not enough to look only at a theoretical regulatory maximum.
Because channel 100 changes more than one variable, I do not use it as proof for the low/medium/high transmit power comparison. I treat it as a practical side observation.
Client Comparison: MacBook vs iPhone
I also captured the same test from an iPhone.
The iPhone results are useful as a second-client comparison, but I treat the MacBook as the primary measurement client because it exposes more detailed Wi-Fi information.
| Test | Channel | MacBook RSSI | iPhone Signal | iPhone Noise | iPhone SNR | Notes |
|---|---|---|---|---|---|---|
| 1 | 44 | -70 dBm | -82 dBm | -96 dBm | 14 dB | Low power |
| 2 | 44 | -56 dBm | -70 dBm | -96 dBm | 26 dB | Medium power |
| 3 | 44 | -52 dBm | -66 dBm | -96 dBm | 30 dB | High power |
| 4 | 100 DFS | -55 dBm | -63 dBm | -98 dBm | 35 dB | DFS comparison |
The exact numbers are not expected to match between the MacBook and the iPhone. They are different client devices, with different radios, antennas, drivers, and measurement methods.
That is actually part of the lesson.
Wireless design should not be based on one ideal client only. It should consider the client types that matter in the environment.
Why I Did Not Use Speedtest as the Main Evidence
I also ran basic Speedtest and Orb checks during the test, but I do not treat those as the primary evidence for this article.
Internet speed tests are influenced by many things outside of RF:
- WAN path
- Speedtest server selection
- ISP behavior
- TCP behavior
- Client behavior
- Background traffic
- Test timing
For this article, the important values are RSSI, noise, SNR, channel, MCS, client-side measurements, and controller-side client RSSI.
Speedtest and Orb are useful as extra user-experience context, but they are not the main RF evidence.
What the Single-AP Lab Shows
This single-AP lab proves one important point:
Increasing AP transmit power made the AP easier for the client to hear.
It also shows the more important bidirectional Wi-Fi point:
Increasing AP transmit power did not make the AP hear the client better.
The AP transmit power affects how loudly the AP talks. It does not change how loudly the client talks back.
This is why client signal bars or client-side RSSI alone are not enough to judge Wi-Fi design.
However, this test does not yet prove that high transmit power is harmful. It proves that higher AP power may not help the uplink.
To show why too much power can be bad, a second test is needed with multiple APs.
Design Takeaways
Transmit power should be planned, not guessed.
A good wireless design considers both sides of the link:
- AP to client
- client to AP
It also considers the real client population, not just the best-performing device.
For me, the main takeaways are:
- More AP power is not automatically better.
- Wi-Fi is bidirectional.
- Client transmit power matters.
- EIRP includes antenna gain and cable loss.
- Receive sensitivity matters.
- High power can create larger cells and sticky clients.
- The LCMI device should influence the design.
- Roaming and airtime behavior matter as much as signal bars.
- A balanced design is usually better than simply making every AP louder.
What Comes Next
This single-AP lab showed the link imbalance clearly:
Increasing AP transmit power improved what the client heard from the AP, but it did not improve how the AP heard the client.
That is an important result, but it does not yet prove that high transmit power is harmful.
To show that, the next test needs multiple APs.
In Part 3, I will enable all three lab APs on the same SSID and test how transmit power affects cell overlap, AP selection, and roaming behavior.
Conclusion
This lab showed the loud AP problem in practice.
When AP transmit power increased, the MacBook reported a much stronger signal. The client-side RSSI improved from -70 dBm at low power to -52 dBm at high power.
But the AP/controller-side client RSSI stayed almost the same, moving only from -63 dBm to -62 dBm.
That is the key point.
The AP became louder. The client did not.
Transmit power is not simply “more is better”. It is one part of a larger RF design, and it needs to be balanced against client capabilities, cell size, roaming behavior, and application requirements.